International Journal of Oral and Craniofacial Science
Face morphometric profiles of groups as early markers for certain diseases?
Roberto Herrero1*, Yoanna Martinez-Diaz2, Heydi Mendez-Vazquez2, Joan Nieves1 and Augusto Gonzalez1
2Advanced Technologies Application Center, Miramar, Havana, Cuba
Cite this as
Herrero R, Martinez-Diaz Y, Mendez-Vazquez H, Nieves J, Gonzalez A (2023) Face morphometric profiles of groups as early markers for certain diseases? Int J Oral Craniofac Sci 9(2): 008-015. DOI: 10.17352/2455-4634.000060Copyright License
© 2023 Herrero R, et al. This is an open-access article distributed under the terms of the Creative Commons Attribution License, which permits unrestricted use, distribution, and reproduction in any medium, provided the original author and source are credited.Background: Face morphometry has been shown to work as a diagnosis tool in a set of syndromes. Face similarities are usually indications of more complete genetic similarities.
Purpose: To show preliminary results on the face morphometry profile of the Cuban population and to argue that it could be used to define early markers for diseases like Alzheimer’s.
Methods: A dataset composed of photos of 200000 men is processed. Facial landmarks are extracted by means of the DLIB library and distances between them are computed. By clustering samples with similar facial traits, groups are formed and their densities inside the population are computed.
Results: The face morphometry profiles for two age cohorts are obtained, showing the population dynamics. Genes involved in facial development are shown to be related to Alzheimer’s disease.
Conclusion: Late multifactorial diseases develop against the genetic background of each individual, which is expressed by its face morphometry. The latter can be thus considered a risk marker.
Abbreviations
AD: Alzheimer’s Disease; FM: Face Morphometry; PCA: Principal Component Analysis; TCGA: The Cancer Genome Atlas
Introduction
Population-wide studies, such as infant height and weight tables [1,2], are useful tools for the early detection of metabolic disorders or any other kind of disruption of normal state in children. By comparing the infant’s parameters with the reference values, we get a first signal of a possible disorder and may proceed to further studies. At present, when the molecular approach to medicine is prevailing more and more in clinical analyses [3-6], genetic and epigenetic markers [7-9] and their reference values in a population become extremely important in many diseases.
However, genetic studies are still relatively expensive [10-12]. In certain situations, in particular the “trivial” Down’s syndrome, a direct examination of the face is enough for diagnosis. Less known, but similarly strong as a marker, is the diagnosis of Down’s syndrome from fingerprint patterns [13]. Both markers: face characteristics and fingerprints, are easily obtained. In a sense, they are indirect markers, that integrate genetic and epigenetic information [14]. As an example of papers using Face Morphometry (FM) for the diagnosis of a set of syndromes, we may cite Refs. [15-19].
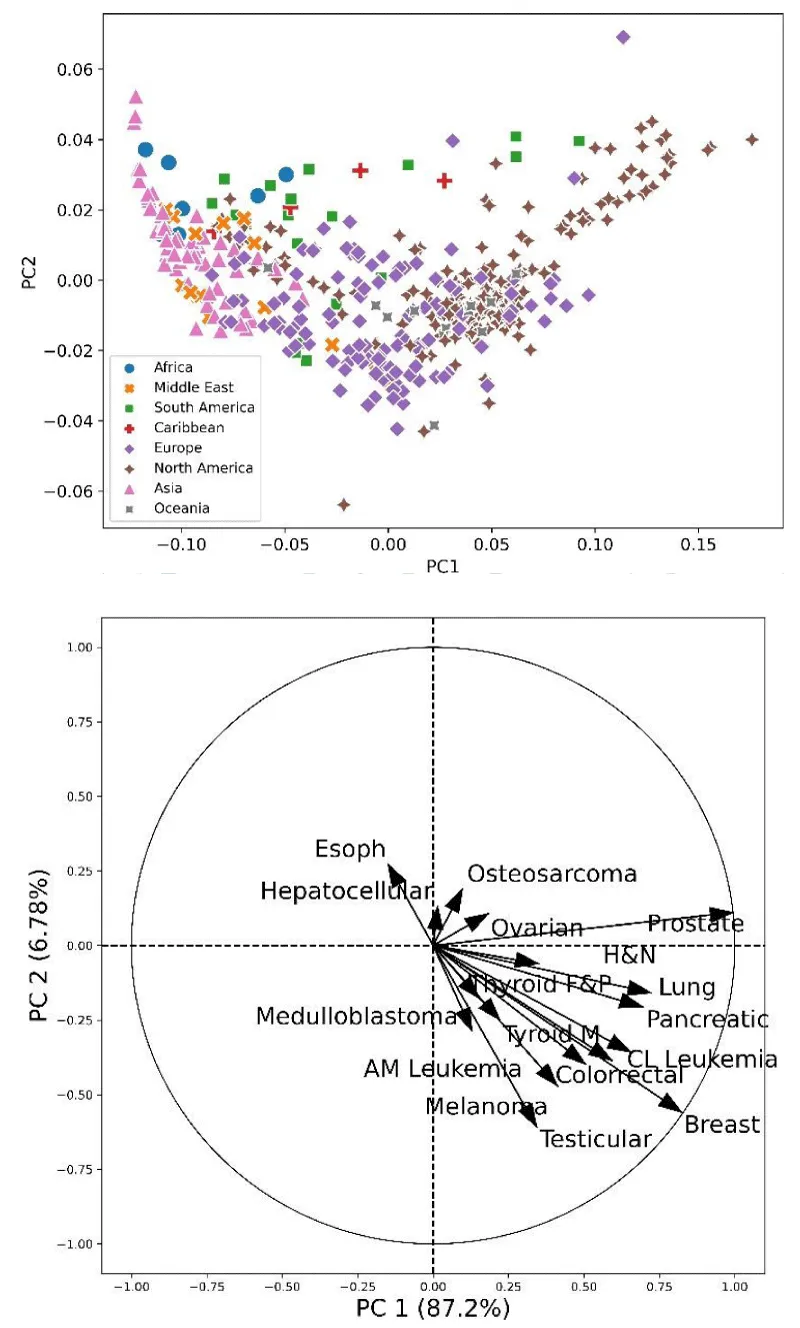
Instead of pretending a diagnosis from indirect markers, we may try to define risk groups inside the population. It is well known that, in many diseases, the risk has an ethnic or group component [20-22]. Consider, for example, the following cancer risk data from 423 cancer registries in the world (Ref. [23], Supplementary information). A Principal Component Analysis (PCA) [24,25] of the data shows that ethnic and cultural groups exhibit distinct patterns, as is apparent in (Figure 1).
For a given population, in particular the Cuban population, mixing between groups could be an element hindering ethnic origins or other factors. A more detailed analysis based on FM measurements, for example, could be a valuable tool to identify groups inside the population and, indirectly, multivariate markers for predisposition to certain diseases.
Materials and methods
We performed a preliminary analysis of FM data of the Cuban population. A group of 200,000 randomly chosen persons, were studied. The data we receive contains only a set of two-dimensional vectors (face landmarks) obtained from the widely used Dlib library [26-30]. Additionally, popular Python data analysis libraries such as NumPy [31], Pandas [32,33], Matplotlib [34], Scikit-Learn [35] and MLxtend [36] were used.
The dataset
As mentioned, a dataset of random 200,000 facial images of Cuban men was processed by means of the DLIB software. The images correspond to two age cohorts - the first comprising men born between 1940 and 1960, and the second including men born between 1961 and 1980. Racial information was also available for each image, but not used.
The landmark localization model was unsuccessful in extracting facial landmarks for 1,968 images in the 40 - 60 years cohort and 470 images in the 61 - 80 years cohort. Combined, these landmark detection failures accounted for approximately 1% of the total image dataset. As such, the missing landmark data is not expected to substantially impact downstream analyses.
Facial landmarks
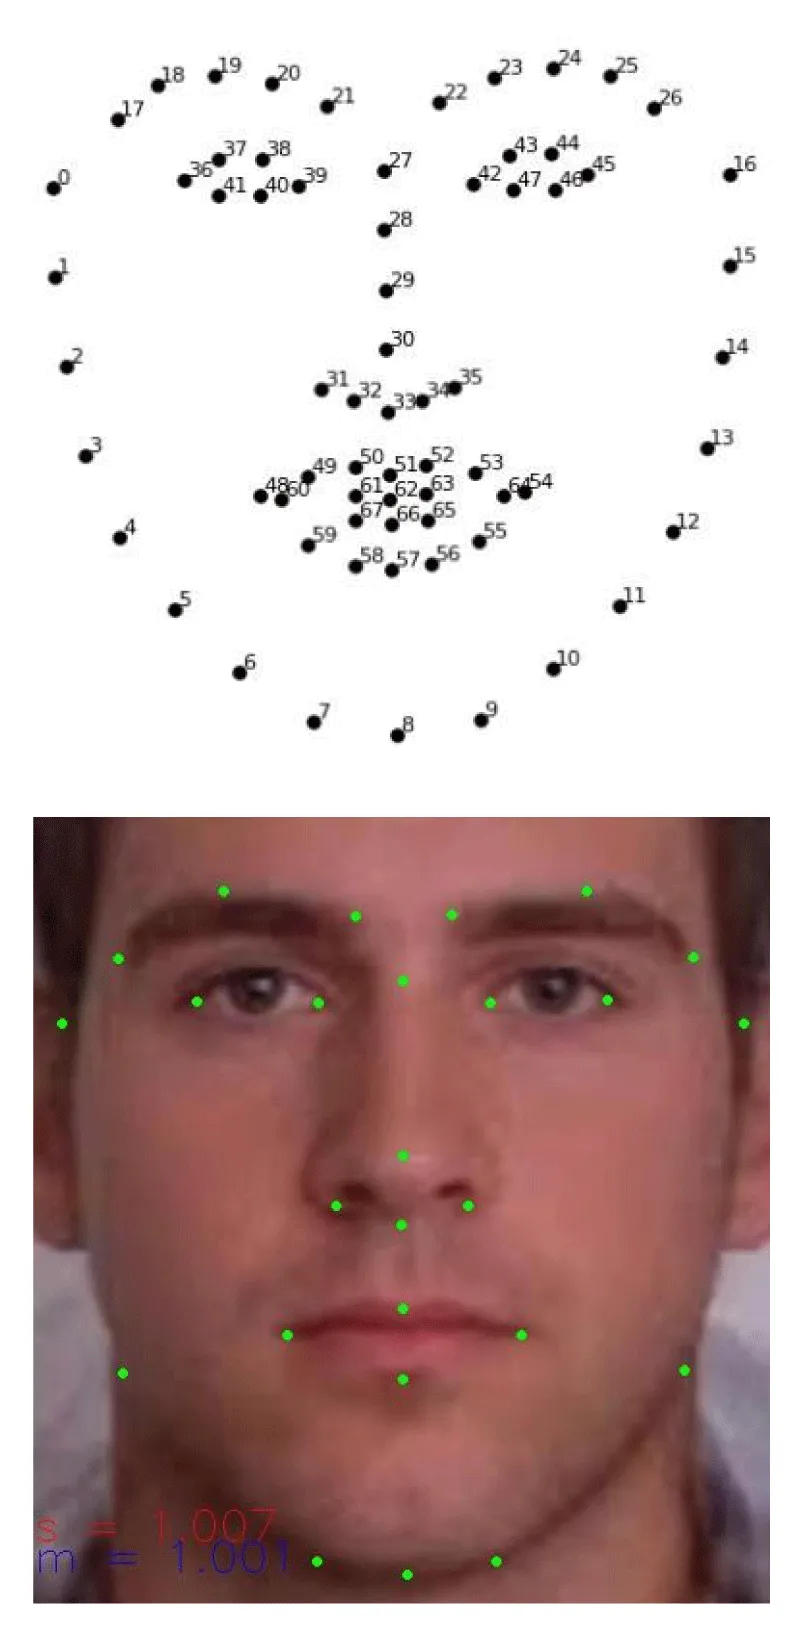
Facial landmark localization was performed using the 68-point face model from the DLIB library. A representation of such points is shown in (Figure 2) top panel [37]. After extracting the landmark coordinates from each image, the landmarks were filtered to select only those representing relevant facial features that accurately reflect the underlying osseous structure. They are represented in (Figure 2) the bottom panel in an image of the public UTKFace dataset (https://susanqq.github.io/UTKFace/, [38]). This accuracy is captured by landmarks that are the most stable against variations in facial expression. Consider, for example, the analysis of eye landmarks. Point 38 would vary with the openness of the eye, while point 39 maintains its position despite such variations. Selecting stable points according to these criteria ensures important noise reduction and guarantees better reproducibility of results across different images of the same person.
Based on these stability criteria, the selected DLIB landmarks were: 0, 4, 7, 8, 9, 12, 16, 17, 19, 21, 22, 24, 26, 27, 30, 31, 33, 35, 36, 39, 42, 45, 48, 51, 54, 57, for a total of 26 points per image.
Let us stress that our landmarks coordinate inference script was tested with public databases. We received from a national database an anonymized pull of numbers (the 68 Dlib landmarks coordinates), respecting in this way the confidentiality of image data and making possible a kind of epidemiological study.
Data filtering
To ensure all facial images exhibit a frontal pose and neutral expression, two filtering criteria were imposed. First, the frontal pose was quantified through a symmetry coefficient defined as s = distance (0,8) / distance (16,8), requiring that 0.90 < s < 1.10, where distance (0,8) denotes the distance between landmarks 0 and 8, for example.
Second, mouth closure was assessed via a coefficient given by: m = y66 / y62, requiring that m < 1.02. In this case, y62 and y66 correspond to the vertical coordinates of the central upper and lower lip landmarks 62 and 66. Tighter clustering of these landmarks indicates mouth closure. Notice that these landmarks are used only for filtering purposes.
Building the distance matrix
Rather than absolute facial landmark coordinates, the distances between landmarks are more informative. Two highly stable landmarks were chosen as reference points, with all other points defined by their normalized distances to these references. Specifically, the outer eye corners (points 36 and 45) served as the reference landmarks in this study, with the distance between them constituting the reference distance for a given image. Each remaining landmark distance was normalized to this image-specific reference distance, resulting in comparable measurements across the dataset.
To reduce dimensionality, symmetric and homologous landmark distances were consolidated by averaging. Symmetric distances were defined as those between landmarks along the mid-sagittal plane (points 8, 27, 30, 33, 51, and 57) and each of the references (e.g. d {8-36} and d_{8-45}).
Equivalent distances were defined as those between symmetrical counterpart landmarks across the mid-sagittal facial plane and the reference landmark on the opposite side of the face (e.g. d_{12-36} and d_{4-45}). Equivalent landmark pairs consisted of (0, 16), (4, 12), (7, 9), (17, 26), (19, 24), (21, 22), (31, 35), (39, 42) and (48, 54). After averaging symmetric and equivalent distances, each facial image was characterized by a 24-dimensional distance vector.
Density map
To reduce dimensionality and decorrelate the data, principal component analysis (PCA) was performed on the distance data. The facial data samples were then projected onto the first 5 principal components, which account for nearly 90% of the variance. The vectors defining the principal components for the 40 - 60 years age cohort are used in the 61 - 80 cohort as well in order to compare them. The space was divided into equal-width intervals. The number of sub-divisions in each component is taken roughly proportional to its variance. Specifically, the first principal component was partitioned into 5 intervals and the second into 3 intervals, resulting in a total of 15 cells partitioning the PC1 vs. PC2 plane, and thus the whole space. Samples are counted in each cell in order to determine the incidence per 1000 individuals and construct the 2D density map.
Results
Face morphometric profile of the Cuban population
As mentioned above, we performed a preliminary analysis of FM data of the Cuban population. To the best of our knowledge, this is the first FM study in a population. Two cohorts of men were studied. The data we receive contains only a set of two-dimensional vectors (face landmarks) obtained from the widely used, Dlib library. We select 26 landmarks based on their importance in the underlying osseous structure and stability with respect to changes in facial expression. From pairs of face points in a normalized image we compute distances. At the end, a vector of 24 distances comes up from each original photo.
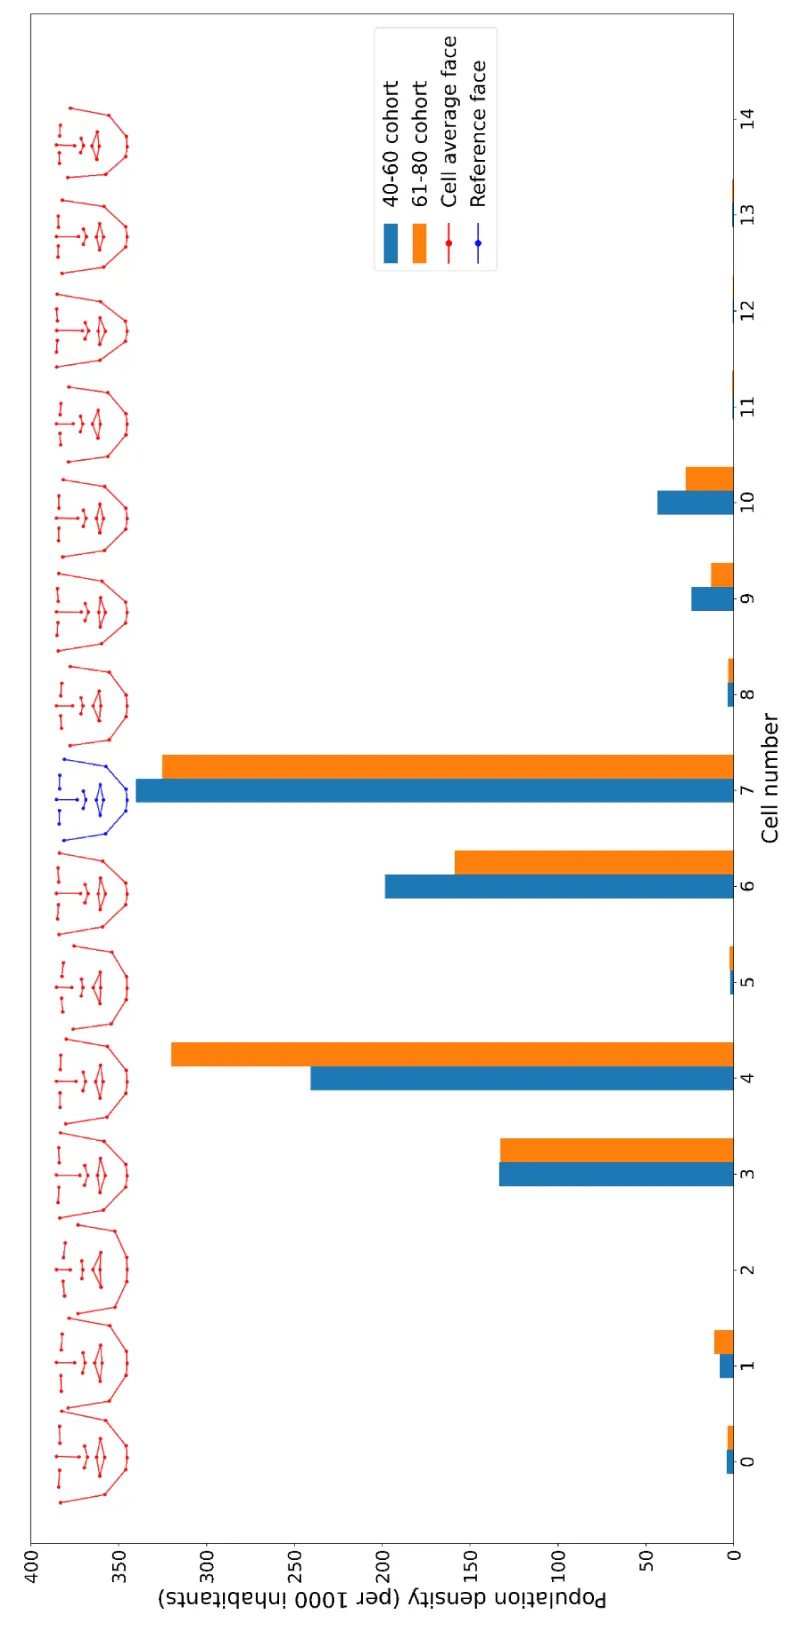
The distance data is processed by means of PCA. The first 5 components are shown to account for nearly 90 % of data variance. We restrict ourselves to these 5 components and divide the PCA space into 15 cells corresponding to well-defined groups of similar face characteristics. The results are shown in (Figure 3) in the form of a histogram comparing the two cohorts. The x-axis is a number labeling the cell, whereas the y-axis is the population density per 1000 inhabitants. That is, if the column height for a given cell is 300, for example, there are 300 men with these facial characteristics per 1000 inhabitants.
We notice that there are measurable differences between cohorts in spite of the relatively small time lapse between them, 20 years. We checked by a kind of bootstrap analysis that in the cells with high differences error bars are small enough, thus differences are not artifacts. Our hypothesis is that the differences signal a change in the mixing dynamics inside the population after the event of the Cuban revolution in 1959, with the abolishment of racial prejudices. As mentioned, these results are preliminary and should be further confirmed.
Face morphometric profiles as early markers?
A figure like (Figure 3), comparing the 40 - 60 cohort with data for AD patients born in the same time interval, for example, would indicate whether there is some population group with higher or lower risk for these diseases. The null hypothesis is that AD patients are randomly distributed inside the population. Thus, the density of AD patients inside a given cell should be proportional to the cell density, with the same proportionality constant for all cells. Deviations in a given cell would indicate an increased (or decreased) risk. Of course, the number of AD patients should be high enough to get relevant statistics. Population-wide studies are needed. A preliminary study is already running in Cuba [39]. On the other hand, as morphometric characteristics are more related to osseous structure than to expression or fat in the face, indications may be used as early risk markers for the younger groups in the same morphometric groups.
It is worth discussing recent findings on the genetics of face and brain shape [40]. Observed correlations are only between FM and brain shape, not affecting behavioral-cognitive traits, in particular AD. One could rephrase these results in a simplified way as the absence of genetic correlations between phase morphometry and early AD.
However, AD is mostly a disease of the elderly [41], essentially multifactorial. There are even hypotheses of infectious origin [42]. These multiple causes evolve against a given genetic background, which may accelerate or slow down the progression towards AD. By measuring correlations between FM and AD we would point out predisposition to AD in later stages of life.
Consider, for example, the more limited set of 51 genes identified in Ref. [43] as involved in facial development. We list them in (Table 1). From them, 16 genes have been related to AD. We indicate in the Table the links to relevant literature. Baseline alterations of these genes could provide a background for the evolution towards AD in later stages of life.
Discussion
A recent surprising result [14] states that facial similarities are indications of more complete genetic similarities among individuals. Thus, our FM groups are probably groups of people with very similar genetic backgrounds, against which factors leading to AD evolve.
The risk for Parkinson’s disease or certain cancers could also be correlated to FM. We indicate also in (Table I) that 21 of these genes are related to cancer, according to Genecards [44]. An example is the Tumor Protein P63 gene (TP63), a member of the P53 family of transcription factors. At the mutational level, there is no correlation to cancer. Probably, a statement like that of Ref. [40] may be formulated: No direct genetic correlation between FM and early cancer. However, cancer is also a multi-factorial disease of the elderly, and the baseline expression level of mutated TP63 could be a factor facilitating evolution toward prostate cancer, for example. Indeed, we identified TP63 among the 33 most important expression markers in prostate cancer [45].
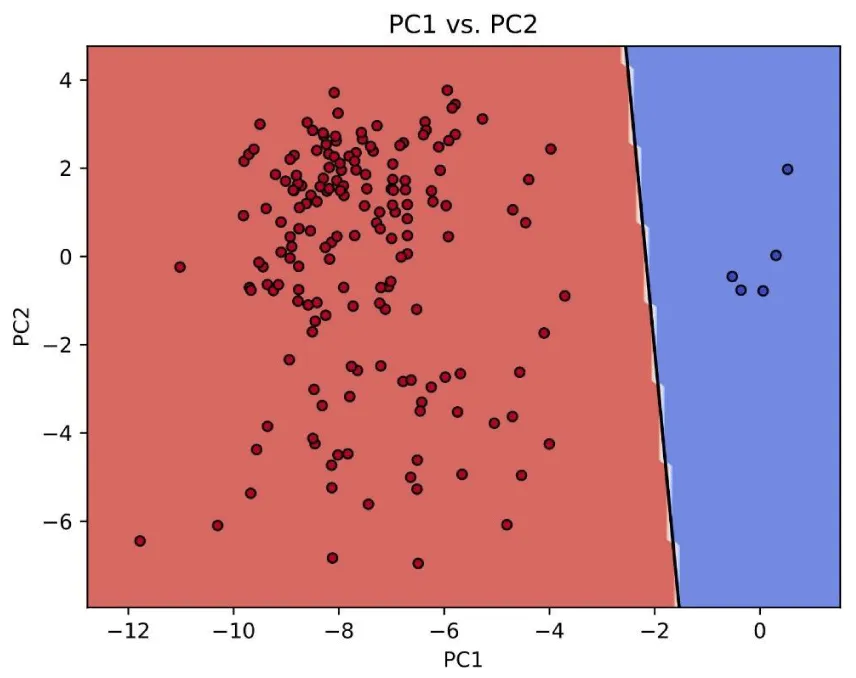
In order to check whether the expressions of the set of 51 genes play a role in defining the tumor state, we perform PCA calculations for TCGA expression data [46] in a set of tissues. Only the 51 genes in the set are used to conform to the PCA matrix. Details on methods can be found elsewhere [47]. In general, this limited set is able to discriminate between a normal tissue and a tumor in many tissues, with low confusion matrices. We show in (Figure 4) an example of perfect discrimination in Glioblastoma. This seemingly surprising result reinforces the idea that the baseline expressions of these genes could play a role in late cancer.
Conclusion
We reported preliminary results for the FM profile of the Cuban population and indicated that it could be used to find risk markers for groups inside the population for diseases such as AD, the idea behind this statement is the following. First, people inside an FM group share a considerable amount of genetic background. Second, multifactorial, late diseases such as AD develop against the genetic background of each individual, thus the background itself may be considered a risk factor. By comparing the density of AD patients with the population density one may, in principle, determine whether there are FM groups with predisposition to AD. As FM groups are based on osseous structure they could be used as early markers for younger groups with the same characteristics, allowing more detailed studies inside the group and early diagnosis. Early markers for other diseases like Parkinson’s and certain cancers could be obtained in the same way. A direct comparison between AD and population data is required in order to validate the statement.
The authors are grateful to Yasser Perera and Gabriel Gil for useful discussions. The authors acknowledge the Cuban Agency for Nuclear Energy and Advanced Technologies (AENTA) and the Office of External Activities of the Abdus Salam Centre for Theoretical Physics (ICTP) for support.
Compliance with ethical standards
Funding: The work was self-funded by the authors.
Author contribution
Roberto Herrero: Data curation and processing, data visualization, formal analysis, investigation, methodology, and validation.
Yoanna Martinez: Data curation and processing, investigation, methodology, and validation. Heydi Mendez: Data curation and processing, supervision, writing- review and editing.
Joan Nieves: Data processing, data visualization, and formal analysis.
Augusto Gonzalez: Conceptualization, formal analysis, methodology, supervision, writing original draft, review, and editing.
- Corredera-Guerra RF, Balado-Sansón RM, Sardiñas-Arce ME, Montesinos-Estévez TC, Gómez-Padrón EI. Weight and height significance related to age. Study carried out in school children from Cerro municipality. Rev. Cubana Med. Gen. Integr 2009; 25(3).
- Khadilkar V, Khadilkar A. Growth charts: A diagnostic tool. Indian J Endocrinol Metab. 2011 Sep;15 Suppl 3(Suppl3):S166-71. doi: 10.4103/2230-8210.84854. PMID: 22029020; PMCID: PMC3183514.
- Schechter AN. Hemoglobin research and the origins of molecular medicine. Blood. 2008 Nov 15;112(10):3927-38. doi: 10.1182/blood-2008-04-078188. PMID: 18988877; PMCID: PMC2581994.
- Liotta LA, Kohn EC, Petricoin EF. Clinical proteomics: personalized molecular medicine. JAMA. 2001 Nov 14;286(18):2211-4. doi: 10.1001/jama.286.18.2211. PMID: 11710876.
- Kurreck J, Stein CA. Molecular medicine: an introduction. John Wiley & Sons. 2016.
- Trevino V, Falciani F, Barrera-Saldaña HA. DNA microarrays: a powerful genomic tool for biomedical and clinical research. Mol Med. 2007 Sep-Oct;13(9-10):527-41. doi: 10.2119/2006-00107.Trevino. PMID: 17660860; PMCID: PMC1933257.
- Pashayan N, Reisel D, Widschwendter M. Integration of genetic and epigenetic markers for risk stratification: opportunities and challenges. Per Med. 2016 Mar 1;13(2):93-95. doi: 10.2217/pme.15.53. PMID: 27053939; PMCID: PMC4820043.
- Herceg Z, Hainaut P. Genetic and epigenetic alterations as biomarkers for cancer detection, diagnosis and prognosis. Mol Oncol. 2007 Jun;1(1):26-41. doi: 10.1016/j.molonc.2007.01.004. Epub 2007 Mar 14. PMID: 19383285; PMCID: PMC5543860.
- Verma M, Manne U. Genetic and epigenetic biomarkers in cancer diagnosis and identifying high risk populations. Crit Rev Oncol Hematol. 2006 Oct;60(1):9-18. doi: 10.1016/j.critrevonc.2006.04.002. Epub 2006 Jul 10. PMID: 16829121.
- Kilbride MK, Bradbury AR. Evaluating Web-Based Direct-to-Consumer Genetic Tests for Cancer Susceptibility. JCO Precis Oncol. 2020 Mar 5;4:PO.19.00317. doi: 10.1200/PO.19.00317. PMID: 34970636; PMCID: PMC8714633.
- Wolff HB, Steeghs EMP, Mfumbilwa ZA, Groen HJM, Adang EM, Willems SM, Grünberg K, Schuuring E, Ligtenberg MJL, Tops BBJ, Coupé VMH. Cost-Effectiveness of Parallel Versus Sequential Testing of Genetic Aberrations for Stage IV Non-Small-Cell Lung Cancer in the Netherlands. JCO Precis Oncol. 2022 Jul;6:e2200201. doi: 10.1200/PO.22.00201. PMID: 35834758; PMCID: PMC9307305.
- Fifer S, Ordman R, Briggs L, Cowley A. Patient and Clinician Preferences for Genetic and Genomic Testing in Non-Small Cell Lung Cancer: A Discrete Choice Experiment. J Pers Med. 2022 May 26;12(6):879. doi: 10.3390/jpm12060879. PMID: 35743664; PMCID: PMC9225087.
- Slatis HM, Katznelson MB, Bonné-Tamir B. The inheritance of fingerprint patterns. Am J Hum Genet. 1976 May;28(3):280-9. PMID: 1266855; PMCID: PMC1685016.
- Joshi RS, Rigau M, García-Prieto CA, Castro de Moura M, Piñeyro D, Moran S, Davalos V, Carrión P, Ferrando-Bernal M, Olalde I, Lalueza-Fox C, Navarro A, Fernández-Tena C, Aspandi D, Sukno FM, Binefa X, Valencia A, Esteller M. Look-alike humans identified by facial recognition algorithms show genetic similarities. Cell Rep. 2022 Aug 23;40(8):111257. doi: 10.1016/j.celrep.2022.111257. PMID: 36001980.
- Ferry Q, Steinberg J, Webber C, FitzPatrick DR, Ponting CP, Zisserman A, Nellåker C. Diagnostically relevant facial gestalt information from ordinary photos. Elife. 2014 Jun 24;3:e02020. doi: 10.7554/eLife.02020. PMID: 24963138; PMCID: PMC4067075.
- Dudding-Byth T, Baxter A, Holliday EG, Hackett A, O'Donnell S, White SM, Attia J, Brunner H, de Vries B, Koolen D, Kleefstra T, Ratwatte S, Riveros C, Brain S, Lovell BC. Computer face-matching technology using two-dimensional photographs accurately matches the facial gestalt of unrelated individuals with the same syndromic form of intellectual disability. BMC Biotechnol. 2017 Dec 19;17(1):90. doi: 10.1186/s12896-017-0410-1. PMID: 29258477; PMCID: PMC5735520.
- Wang J, Liang B, Zhao L, Chen Y, Fu W. Multiple Genetic Syndromes Recognition Based on a Deep Learning Framework and Cross-Loss Training. IEEE Access 2022;10:117084-92.
- Hsieh TC, Bar-Haim A, Moosa S, Ehmke N, Gripp KW, Pantel JT, Danyel M, Mensah MA, Horn D, Rosnev S, Fleischer N, Bonini G, Hustinx A, Schmid A, Knaus A, Javanmardi B, Klinkhammer H, Lesmann H, Sivalingam S, Kamphans T, Meiswinkel W, Ebstein F, Krüger E, Küry S, Bézieau S, Schmidt A, Peters S, Engels H, Mangold E, Kreiß M, Cremer K, Perne C, Betz RC, Bender T, Grundmann-Hauser K, Haack TB, Wagner M, Brunet T, Bentzen HB, Averdunk L, Coetzer KC, Lyon GJ, Spielmann M, Schaaf CP, Mundlos S, Nöthen MM, Krawitz PM. GestaltMatcher facilitates rare disease matching using facial phenotype descriptors. Nat Genet. 2022 Mar;54(3):349-357. doi: 10.1038/s41588-021-01010-x. Epub 2022 Feb 10. PMID: 35145301; PMCID: PMC9272356.
- Gurovich Y, Hanani Y, Bar O, Nadav G, Fleischer N, Gelbman D, Basel-Salmon L, Krawitz PM, Kamphausen SB, Zenker M, Bird LM, Gripp KW. Identifying facial phenotypes of genetic disorders using deep learning. Nat Med. 2019 Jan;25(1):60-64. doi: 10.1038/s41591-018-0279-0. Epub 2019 Jan 7. PMID: 30617323.
- Coram MA, Fang H, Candille SI, Assimes TL, Tang H. Leveraging Multi-ethnic Evidence for Risk Assessment of Quantitative Traits in Minority Populations. Am J Hum Genet. 2017 Aug 3;101(2):218-226. doi: 10.1016/j.ajhg.2017.06.015. Epub 2017 Jul 27. Erratum in: Am J Hum Genet. 2017 Oct 5;101(4):638. PMID: 28757202; PMCID: PMC5544393.
- Magesh S, John D, Li WT, Li Y, Mattingly-App A, Jain S, Chang EY, Ongkeko WM. Disparities in COVID-19 Outcomes by Race, Ethnicity, and Socioeconomic Status: A Systematic-Review and Meta-analysis. JAMA Netw Open. 2021 Nov 1;4(11):e2134147. doi: 10.1001/jamanetworkopen.2021.34147. Erratum in: JAMA Netw Open. 2021 Dec 1;4(12):e2144237. Erratum in: JAMA Netw Open. 2022 Feb 1;5(2):e222170. PMID: 34762110; PMCID: PMC8586903.
- Bancks MP, Bertoni AG, Carnethon M, Chen H, Cotch MF, Gujral UP, Herrington D, Kanaya AM, Szklo M, Vaidya D, Kandula NR. Association of Diabetes Subgroups With Race/Ethnicity, Risk Factor Burden and Complications: The MASALA and MESA Studies. J Clin Endocrinol Metab. 2021 Apr 23;106(5):e2106-e2115. doi: 10.1210/clinem/dgaa962. PMID: 33502458; PMCID: PMC8063247.
- Tomasetti C, Li L, Vogelstein B. Stem cell divisions, somatic mutations, cancer etiology, and cancer prevention. Science. 2017 Mar 24;355(6331):1330-1334. doi: 10.1126/science.aaf9011. PMID: 28336671; PMCID: PMC5852673.
- Lever J, Krzywinski M, Altman N. Principal component analysis. Nat Methods. 2017; 14, 641–642.
- Schreiber JB. Issues and recommendations for exploratory factor analysis and principal component analysis. Res Social Adm Pharm. 2021 May;17(5):1004-1011. doi: 10.1016/j.sapharm.2020.07.027. Epub 2020 Aug 15. PMID: 33162380.
- King DE. Dlib-ml: A machine learning toolkit. The Journal of Machine Learning Research. 2009; 10:1755-8.
- Boyapally SR, Supreethi KP. Facial Recognition and Attendance System Using Dlib and Face Recognition Libraries. 2021 International Research Journal of Modernization in Engineering Technology and Science. 2021:409-17.
- l-Nuaimi A, Mohmmed G. A New Method for Head Direction Estimation based on Dlib Face Detection Method and Implementation of Sine Inverse Function. Journal of Education and Science. 2021;30(5):114-24.
- Mohanty S, Hegde SV, Prasad S, Manikandan J. Design of real-time drowsiness detection system using dlib. In2019 IEEE International WIE Conference on Electrical and Computer Engineering (WIECON-ECE). 2019: 1-4.
- Kavitha R, Subha P, Srinivasan R, Kavitha M. Implementing OpenCV and Dlib Open-Source library for detection of driver’s fatigue. InInnovative Data Communication Technologies and Application: Proceedings of ICIDCA 2021. 2022; 353-367.
- Harris CR, Millman KJ, van der Walt SJ, Gommers R, Virtanen P, Cournapeau D, Wieser E, Taylor J, Berg S, Smith NJ, Kern R, Picus M, Hoyer S, van Kerkwijk MH, Brett M, Haldane A, Del Río JF, Wiebe M, Peterson P, Gérard-Marchant P, Sheppard K, Reddy T, Weckesser W, Abbasi H, Gohlke C, Oliphant TE. Array programming with NumPy. Nature. 2020 Sep;585(7825):357-362. doi: 10.1038/s41586-020-2649-2. Epub 2020 Sep 16. PMID: 32939066; PMCID: PMC7759461.
- McKinney W. Data structures for statistical computing in Python. InProceedings of the 9th Python in Science Conference. 2010; 445(1): 51-56.
- Reback J, McKinney W, Van Den Bossche J, Augspurger T, Cloud P. Zenodo. 2020.
- Hunter JD. Matplotlib: A 2D graphics environment. Computing in science & engineering. 2007;9(03):90-5.
- Pedregosa F, Varoquaux G, Gramfort A, Michel V, Thirion B. Scikit-learn: Machine learning in Python. the Journal of Machine Learning Research. 2011; 12:2825-30.
- Raschka S. MLxtend: Providing machine learning and data science utilities and extensions to Python’s scientific computing stack. Journal of open source software. 2018;3(24):638.
- Li D, Wang Z, Gao Q, Song Y, Yu X, Wang C. Facial expression recognition based on Electroencephalogram and facial landmark localization. Technol Health Care. 2019;27(4):373-387. doi: 10.3233/THC-181538. PMID: 30664515.
- Zhang Z, Song Y, Qi H. Age progression/regression by conditional adversarial autoencoder. In Proceedings of the IEEE conference on computer vision and pattern recognition. 2017; 5810- 5818.
- López Ricardo Y, Reyes Zamora MC, Perodin Hernández J, Rodríguez Martínez C. Prevalence of Alzheimer's disease in rural and urban areas in Cuba and factors influencing on its occurrence: epidemiological cross-sectional protocol. BMJ Open. 2022 Nov 2;12(11):e052704. doi: 10.1136/bmjopen-2021-052704. PMID: 36323463; PMCID: PMC9639064.
- Naqvi S, Sleyp Y, Hoskens H, Indencleef K, Spence JP, Bruffaerts R, Radwan A, Eller RJ, Richmond S, Shriver MD, Shaffer JR, Weinberg SM, Walsh S, Thompson J, Pritchard JK, Sunaert S, Peeters H, Wysocka J, Claes P. Shared heritability of human face and brain shape. Nat Genet. 2021 Jun;53(6):830-839. doi: 10.1038/s41588-021-00827-w. Epub 2021 Apr 5. PMID: 33821002; PMCID: PMC8232039.
- 2023 Alzheimer's disease facts and figures. Alzheimers Dement. 2023 Apr;19(4):1598-1695. doi: 10.1002/alz.13016. Epub 2023 Mar 14. PMID: 36918389.
- Vojtechova I, Machacek T, Kristofikova Z, Stuchlik A, Petrasek T. Infectious origin of Alzheimer's disease: Amyloid beta as a component of brain antimicrobial immunity. PLoS Pathog. 2022 Nov 17;18(11):e1010929. doi: 10.1371/journal.ppat.1010929. PMID: 36395147; PMCID: PMC9671327.
- Richmond S, Howe LJ, Lewis S, Stergiakouli E, Zhurov A. Facial Genetics: A Brief Overview. Front Genet. 2018 Oct 16;9:462. doi: 10.3389/fgene.2018.00462. PMID: 30386375; PMCID: PMC6198798.
- Safran M, Solomon I, Shmueli O, Lapidot M, Shen-Orr S, Adato A, Ben-Dor U, Esterman N, Rosen N, Peter I, Olender T, Chalifa-Caspi V, Lancet D. GeneCards 2002: towards a complete, object-oriented, human gene compendium. Bioinformatics. 2002 Nov;18(11):1542-3. doi: 10.1093/bioinformatics/18.11.1542. PMID: 12424129.
- Perera Y, Gonzalez A, Perez R. Principal component analysis of RNA-seq data unveils a novel prostate cancer-associated gene expression signature. Arch. Can. Res. 2021; 9(S4): 002.
- Tomczak K, Czerwińska P, Wiznerowicz M. The Cancer Genome Atlas (TCGA): an immeasurable source of knowledge. Contemp Oncol (Pozn). 2015;19(1A):A68-77. doi: 10.5114/wo.2014.47136. PMID: 25691825; PMCID: PMC4322527.
- Gonzalez A, Leon DA, Perera Y, Perez R. On the gene expression landscape of cancer. PLoS One. 2023 Feb 21;18(2):e0277786. doi: 10.1371/journal.pone.0277786. PMID: 36802377; PMCID: PMC9942972.
Article Alerts
Subscribe to our articles alerts and stay tuned.
 This work is licensed under a Creative Commons Attribution 4.0 International License.


 Save to Mendeley
